
Line Profile
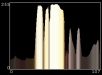
The line profile module will allow you to better investigate the pixels values along a specified line. The values of each pixel is charted such that the intensity of the pixel is the Y axis (height) and the pixel number along the specified line is the X axis (width). This arrangement better illustrates the neighborhood of a particular pixel from a different perspective.The Line Profile module will also place the generated chart and the sampled pixel values into variables that can be accessed by other modules or saved for later usage.
Interface
Instructions
1. Line Coordinates - Specify the appropriate coordinates for the line. You will see a green and purple square connected by a line in the main RoboRealm image. This illustrates where the line is currently sampling the image. You can either specify a number directly in the provided text fields, or use the up and down spin buttons to change the value of these coordinates. Alternatively you can use the [expression] syntax to programmatically move the line location using other variables or formulas.
2. Data - Select which data channel you wish to plot. The default Colored channel uses the pixels intensity to determine height but then uses the original pixel values color when drawing the area chart.
3. Smooth - If the plotted data appears too noisy try increasing the smoothing factor to reduce the noise. This will cause the plot to become smoother and more rounded. Peaks and valleys become more evident with smoothing.
4. Normalize - If selected the data will be normalized which will map the pixel values into a full intensity range to better illustrate the peaks and valleys of the sampled data.
5. Plot Type - Line will display the data as a single line plot whereas Area will fill the chart to better show the height of the sampled pixels.
6. Background Color - Depending on the data being plotted the chart background can be changed to better show the graph values. Select any of the radio buttons to change the background color.
7. Display Line - if you don't wish to see where the line is being sampled uncheck this checkbox. Note that sometimes when switching to other images the line annotation will still be active, thus switching off the display will remove this confusion.
8. Draw Chart Graphics - This specifies that the axis lines and values are included in the line profile image. While convienient to view, often the profile graphic is used in subsequant processing (exposed in the main RoboRealm GUI using the Marker module) which requires no axis or annotations.
Variables
LINE_PROFILE_VALUES - the array of pixel values that generated the chart
LINE_PROFILE - the chart image saved as an image that can be used in
  other modules that use an image dropdown selection.
See Also
Sample_Line
Sample_Color
Line_Probe
| New Post |
| Line_Profile Related Forum Posts | Last post | Posts | Views |
 Line Profile Axis
Hi All, I used Line Profile to detect the gap between the Canyon(two border black lines). It was go... |
10 year | 3 | 3393 |

Hi, I am trying to detect the border's of curved metal plate, i want to matc... |
13 year | 3 | 4190 |