
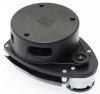
RoboPeak RPLidar
The RoboPeak RPLidar module provides an interface to the RPLidar device. The RPLidar is a low cost lidar sensor suitable for indoor robotic SLAM application. It provides 360 degree scan field, 5.5hz rotating frequency with guaranteed 6 meter ranger distance. RPLidar is the ideal sensor in cost sensitive areas like consumer robotics and hardware hobbyists.Special thanks to Dave Everett for the loan of the RPLidar. Be sure to visit this Robot Workshop in Sydney.
Interface
Instructions
1. COM Port - Specify which COM port the RPLidar is attached to. Once connected the Green connection bar will show and the device Model, Firmware and Serial number will appear in the interface.
2. Remember As Default - Select the "Remember as Default" checkbox if you would like the current COM setting to be remembered by RoboRealm such that whenever the lidar is loaded the COM port will be auto-selected. This ability allows you to not have to constantly change the COM port when loading in successive RoboRealm configurations.
3. Filter - To smooth out the signal and avoid gaps you can smooth the distance values coming in from the lidar within their local neighborhood. Thus noisy spikes are reduced as their previous and next angular measurements are averaged into each value.
4. Display Zoom - Select how much zoom to apply to the current view. Auto will detect the furthest object and scale the display accordingly. This may cause the map to jump in scale as distant parts are typically noisy.
5. Display Fill - Check if you want the graphic to be filled with the specified color as apposed to an outline.
6. Display Chart Type - Select how you want the values to be displayed.
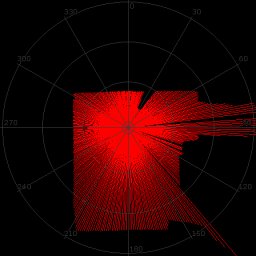
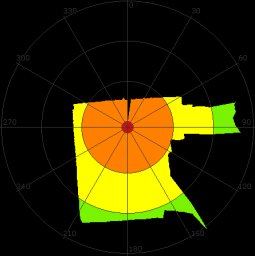 Radial - Displays the range points connected as you would expect them to be seen in reality. Note that
areas perpendicular to the sensor are connected despite no actual values being present. (i.e. changes in
depth are connected between values).
Radial - Displays the range points connected as you would expect them to be seen in reality. Note that
areas perpendicular to the sensor are connected despite no actual values being present. (i.e. changes in
depth are connected between values).
 Cartesian - Displays the range values in a traditional XY chart.
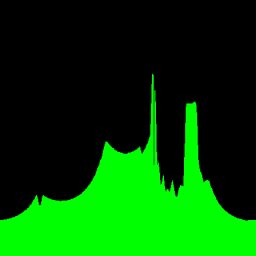
 Intensity - Displays the range values as a single row with intensity values based on actual range. Brighter
objects are closer.
Intensity - Displays the range values as a single row with intensity values based on actual range. Brighter
objects are closer.
 Points - Displays the raw points as received from the laser scanner.
7. Display Color - Select the color you want the graphic display to use.
8. Graphic Size - Select the line, or point size that should be used when displaying the graphic.
9. Average Statistic - Select if you want a variable to be created that indicates the average of all the range data.
10. Maximum Statistics - Select if you want a variable to be created that indicates the maximum distance within the range data.
11. Minimum Statistics - Select if you want a variable to be created that indicates the minimum distance within the range data.
Variables
ROBOPEAK_RPLIDAR_POINTS - the distance points as returned by the RPLidar device
ROBOPEAK_RPLIDAR_AVERAGE_VALUE - average value of all the range data
ROBOPEAK_RPLIDAR_AVERAGE_ANGLE - average angle of all the range data
ROBOPEAK_RPLIDAR_MINIMUM_VALUE - the minimum value detected in all the range data
ROBOPEAK_RPLIDAR_MINIMUM_ANGLE - the angle towards the minimum detected value
ROBOPEAK_RPLIDAR_MAXIMUM_VALUE - the maximum value detected in all the range data
ROBOPEAK_RPLIDAR_MAXIMUM_ANGLE - the angle towards the maximum detected value
Markers
RoboPeak_RPLidar_Graphic - graphic shown in GUI
See Also
Hokuyo URG
Laser Line
For more information
RoboPeak Website