
Intensity Plot
The Intensity Plot module provides a way to view the intensity profile of an image based on the values in a vertical column. This is different than a histogram transformation of the image in that the resulting image is of the same width as the original image but with a height of 256 to represent the 256 intensity values of each column. To generate the image each column of the original image is converted to grayscale and the resulting value for each pixel is recorded. Once the column has been processed the chart is generated with each resulting pixel's intensity relating to the amount of original pixels that are at that intensity value (0-255). The width of the resulting image will be the same as the source, the height, however, will always be 256 as the number of intensity levels checked is always 256.
Interface
Instructions
1. 0 - 255 Grayscale - This display shows the number of pixels per vertical row scaled from 0 to 255
2. 128 - 255 Grayscale - This display shows the number of pixels per vertical row scaled from 128 to 255
3. Black & White - This display shows pixels that exceed the threshold count as white.
Example
| Source | Intensity Plot |
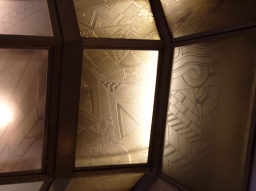 | 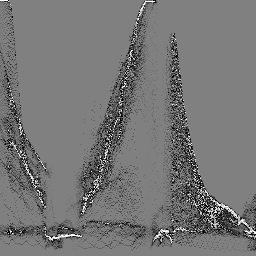 |
See Also
Histogram
Surface Plot
| New Post |
| Intensity_Plot Related Forum Posts | Last post | Posts | Views |
| None |