
View Histogram
The view histogram interface provides you with a view of the image's current histogram graph depending on where the view histogram is inserted into the processing pipeline. A histogram is a graphical display of the number of pixels (the Y or vertical axis) with the pixel value (the X or horizontal axis 0-255). Using an images histogram you can quickly see the pixel color distribution and how the various image processing components effect an images histogram.It is essentially provides another way of looking at the same image information. The vertical axis representing the number of pixels at that intensity and the horizontal axis representing the color intensity of the image's pixels.
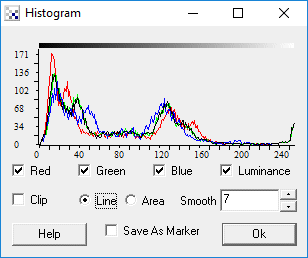
Interface
Instructions
1. Select which color channel (red, green, blue, intensity) you would like to see displayed in the histogram.
2. Select the chart type - line or bar.
3. Select the amount of histogram smoothing to perform. Smoothing the histogram allows you gain a better
understanding of the histogram's shape by reducing the amount of minor spikes that typically occur in a histogram.
Example
Image

Variables
RED_HIST - the values that are used to create the red color histogram
GREEN_HIST - the values that are used to create the green color histogram
BLUE_HIST - the values that are used to create the blue color histogram
GRAY_HIST - the values that are used to create the gray color histogram
See Also
| New Post |
| Histogram Related Forum Posts | Last post | Posts | Views |
| None |