
Display Point
The Display Point module provides a way to illustrate the location of certain points. Using a variety of ways the Display Point module can draw a symbol at a certain location.
Interface
Instructions
1. Data Source - Select the appropriate variable that contains the coordinates of the point that you want to display. You can also specify the coordinates by typing them into the provided X and Y text boxes.
2. Appearance - Select the color, shape, and size of the symbol to draw at the specified location.
3. Display as Annotation - Select if you want the graphic to be draw after all processing has been completed. If this is NOT selected then the next module in the processing pipeline will see the graphic as if it were part of the image and process it accordingly.
4. Clear current image - Select to clear the current image and draw the graphics on a black image.
5. Data Source - Select where the point coordinates should be taken from.
6. Shape, Color, Size - Specify the shape, color and size of the graphic that is used to indicate the point location.
Example
| Source | Display Point (Blob COG labeling) |
 | 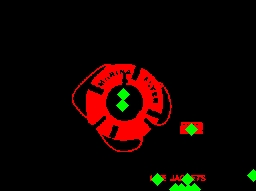 |
| New Post |
| Display_Point Related Forum Posts | Last post | Posts | Views |

Hi, I have 2 different pipeline for different detection characteristics which is: 8 year |
18 |
3497 |
|
|
The Mouse_Click_X variable doesn't appear to be set properly in fullscreen mode. I'm using windows 7. An... |
14 year | 2 | 2838 |

Hi! I have a little problem... I am trying to find min_x and max_x value on a speciefied Y (for example COG_Y). I... |
14 year | 6 | 6594 |