
Peak & Valley Probe
The Peak & Valley Probe provide a way to locate peaks (maximum points) and valleys (minimum points) along a specifed line in an image. This is similar to the Edge Probe but instead of detecting large changes in intensity this module will detect the change in direction of intensity. This is useful in detecting patterns, frequencies or recocurring objects.To better visualize these peaks and valleys you can use the Line Profile module that displays the pixel intensities along a line. If you see a nice peak and valley curve then it is a good candidate for the Peak & Valley Probe module.
Interface
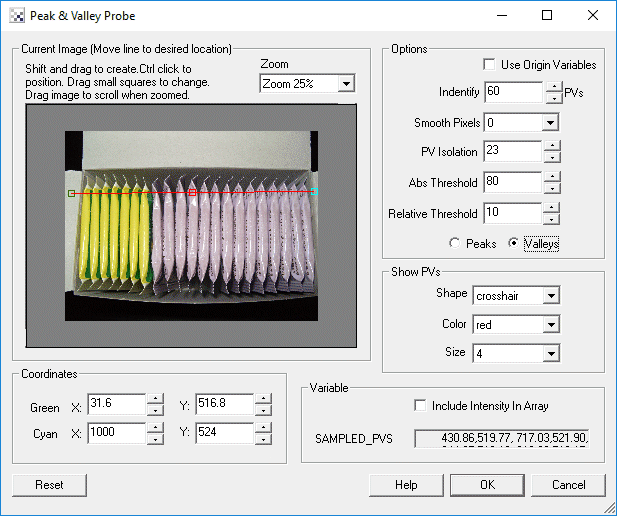
Instructions
1. Coordinates - Specify the line location to probe for peaks or valleys. You can either drag the squares in the Current Image display or specify the numbers in the provided text boxes. Keep in mind that the [expression] notation also applies in the text box.
Use CTRL-click to move the entire probe to a different location. Use SHIFT-drag to create the probe of a certain size in the clicked position. When zoomed in, drag the image around to view different parts of the image or expand the dialog window to view more of the image.
2. Use Origin - You can specify that the current coordinates are relative to the Origin Variables created by the Origin Probe Module (or by setting these variables yourself). This allows the specified coordinates to move relative to the detected origin in case what you are sampling is not always in the same absolute image location. When you select this checkbox the current origin values are subtracted from the currently specified coordinates to create a relative position. If you have not yet set the origin, you can come back later and adjust the coordinates as appropriate.
3. Options Identity - Specify the maximum number of peaks or probes you want to detect.
4. Options Smooth - If you are detecting too many peaks or valleys try smoothing the pixels. This will reduce intensity noise and produce better results.
5. Options Isolation - To avoid detecteding too many points close to each other increase the isolation count. This will force only the best detection per X pixels to be recorded.
6. Options Abs Threshold - Select how high a peak needs to be before it could be qualified as a peak OR how low a valley needs to be before it could be qualified as a valley.
7. Options Relative Threshold - Select how low a valley must exists between two peaks or how high a peak much exist between two valleys. This helps to reduce local dips or bumps that might trigger an incorrect peak or valley detection.
8. Select if you are detecting a peak or valley.
9. Zoom - Select the zoom for the Current Image in case it is too large or small for the provided viewing area.
10. Show PVs - to visually see which points are detected (in the main RoboRealm interface) select the appropriate Color and Thickness of the point that will indicate where in the image the peak or valley has been detected.
11. Include Intensity - If you want to know the intensity value in addition to the peak or valley coordinates select the Include Intensity checkbox. This will add the intensity value after the X and Y coordinates in the recorded array PROBED_PEAK_VALLEY.
Example
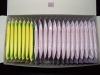
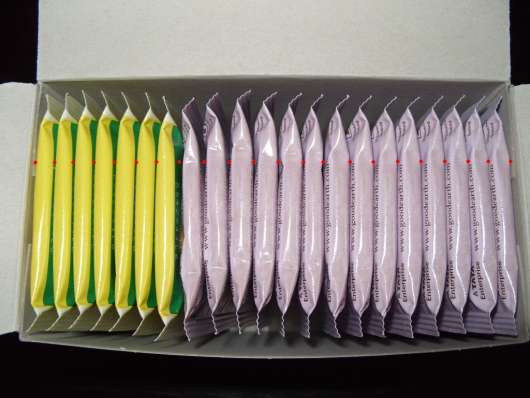
Red spots are used to detect the valleys inbetween the tea bags. The total count-1 is the number of tea bags.
| Peak & Valley Probe |
 |
![]() Click here to download this example and run in RoboRealm.
Click here to download this example and run in RoboRealm.
Variables
PROBED_PEAK_VALLEY_COUNT - the number of peaks or valleys found

PROBED_PEAK_VALLEY - an x,y array of the location of the detected peaks
  or valleys.

OR

PROBED_PEAK_VALLEY - an x,y,intensity array of the location of the detected peaks
  or valleys along with the intensity value depending on the setting of
  Include Intensity checkbox.
See Also
Origin Probe
Line Profile
Edge Probe
| New Post |
| Peak_Valley_Probe Related Forum Posts | Last post | Posts | Views |
| None |